DACF Home → Bureaus & Programs → Maine Geological Survey → Maps, Publications and Online Data → Using Geologic Maps → Reading Surficial Geology Maps
Reading Surficial Geology 1:24,000-scale Maps
What's on the maps?
A surficial geology map shows the areal distribution of all the loose materials such as till (commonly called hardpan), sand and gravel, or clay, which overlie solid ledge (bedrock). Most of the surficial materials are deposits formed by glacial and deglacial processes during the last stage of continental glaciation, which began about 35,000 years ago. The remainder of the surficial deposits are the products of postglacial geologic processes, such as river flood plains, or are attributed to human activity, such as road fill or other land-modifying features.
Uses of the maps
Surficial geology maps are often best used in conjunction with related maps such as surficial materials maps or significant sand and gravel aquifer maps for anyone wanting to know what lies beneath the land surface.
- In conjunction with significant sand and gravel aquifer maps, these maps may aid in the search for water supplies.
- Modern construction projects require vast amounts of aggregate materials. Surficial geology maps can be used to locate economically important deposits such as sand and gravel for aggregate or clay for bricks or pottery.
- Evaluation of the location of surficial materials helps address environmental issues such as the location of potential contamination sources such as landfills, salt/sand piles, and underground storage tanks.
- The extent and type of surficial materials is directly related to the possible spread of contaminants from a potential hazardous waste spill.
- Knowledge of surficial geology is essential in construction projects such as locating new roads and transportation planning.
- On a more local scale, excavating foundations or siting new homes may be better planned with a good knowledge of the surficial geology of the site.
Definitions
Understanding the following terms will help you interpret what you see on a surficial geology map.
What are surficial materials?
Geologic processes such as weathering and erosion break bedrock down into smaller particles of sediment. Sediments such as clay, silt, sand, gravel, and other loose deposits which lie on top of bedrock are grouped together in the general category of "surficial materials." These materials are not soils; they are the deeper earth materials that lie between the soil zone and the underlying bedrock. Soils commonly develop by weathering of the uppermost part of these materials. Refer to the fact sheet "Introduction to Surficial Materials" for images of the textures of materials found in Maine.
Where can I find definitions for other terms used on the maps?
Glossary of terms used on surficial geology maps
Tips for Reading the Maps - Geologic Unit Boundaries
What are the colored areas on the map?
The colored areas on the map represent surficial materials of different textures and origins (Figure 1). The black lines between these areas are called "contacts" and represent the boundaries between different materials. The colored areas represent the surface distribution of materials and do not indicate materials at depth. For an indication of underlying materials, the user should refer to subsurface information shown on the related surficial materials map.
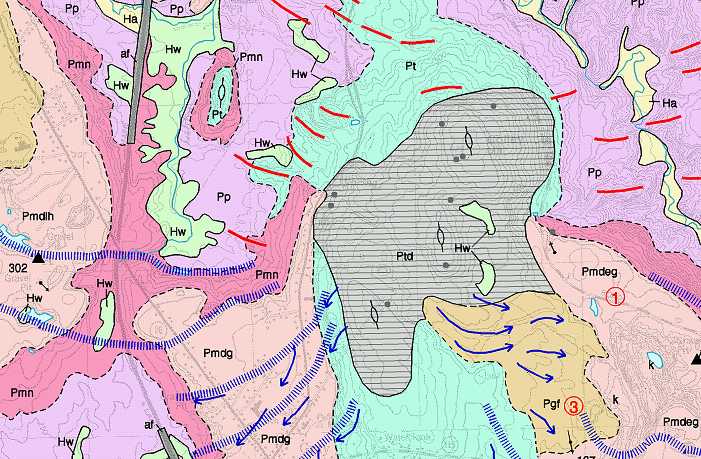
Figure 1. Portion of surficial geology map of the Gray 7.5-minute quadrangle. Colored areas show the distribution of unconsolidated materials at the land surface.
How accurate are the unit boundaries?
The accuracy of the surficial unit boundaries depends on the amount of data collected in the area, such as test hole logs, seismic lines, well logs, etc. By looking at a plot of the surficial materials map, the reader can see where accuracy of the contacts between geologic units on the surficial geology map has strong or weak control (Figure 2). Note that the surficial map just shows what is at surface; it doesn't show buried units UNLESS the unit label is a "sandwich" symbol (Figure 3).
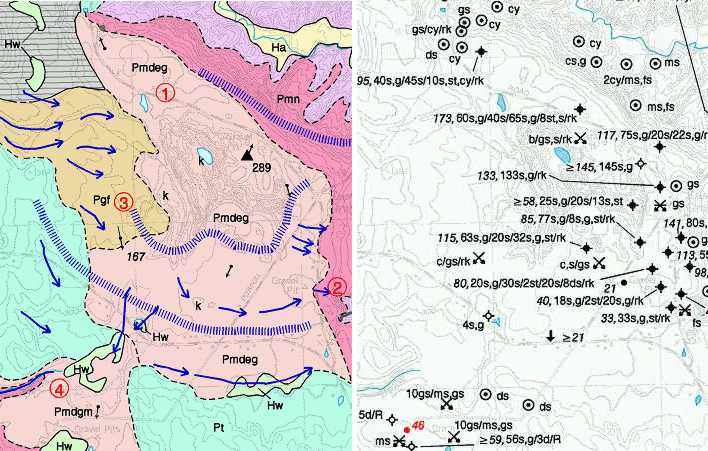
Figure 2. Portion of a surficial geology map (left) and a surficial materials map (right). Note how the data observations on the materials map are clustered around the eastern border of the Pmdeg unit. As a result, the Pmdeg-Pmn boundary is the most accurately located boundary on this part of the map. Other boundaries were interpreted from topography and air photos.
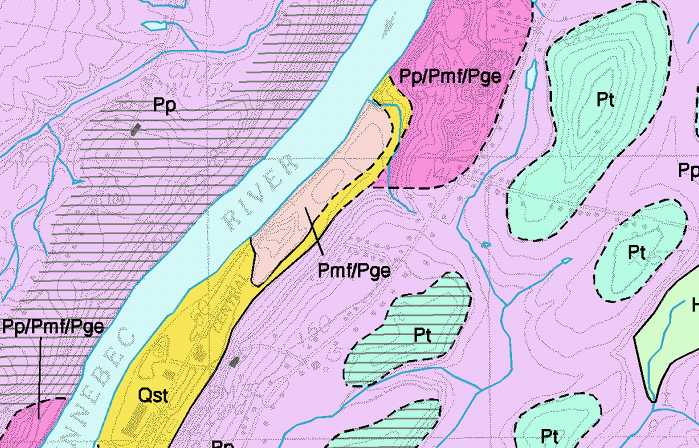
Figure 3. Portion of surficial geology map of the Togus Pond 7.5-minute quadrangle. Two "sandwich" symbols are shown. Pp/Pmf/Pge - should be read as Presumpscot Formation over marine fan deposits over esker deposits. Pmf/Pge - read as marine fan deposits over esker deposits. These labels indicate subsurface geology.
Does the shape of the land surface (topographic contours) relate to the surficial units?
Topography is an important characteristic of surficial landforms. For instance, a marine delta may be identified by its extremely flat surface (Figure 4). Moraines appear as linear ridges. In coastal Maine, elevation is another important variable. Marine clay was deposited up to specific elevations across coastal portions of the state. This fact allows the mapper to interpret the contact based on elevation. Such indicators of glacial geomorphology are useful in mapping geologic units when the mapper has few ground-truth points.
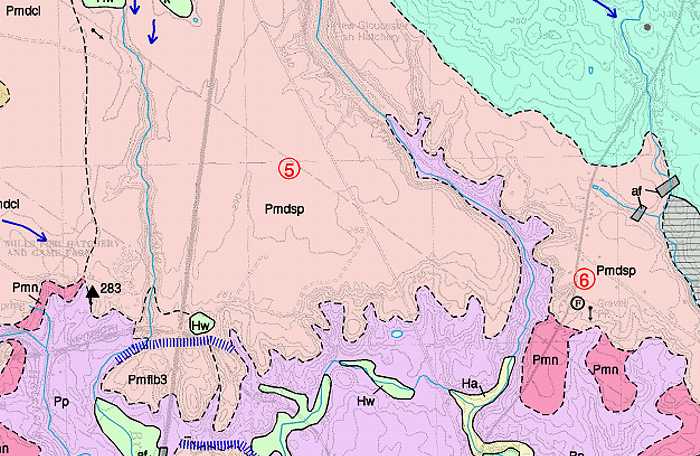
Figure 4. Portion of surficial geology map of the Gray 7.5-minute quadrangle. Topography is an important characteristic of surficial landforms. A marine delta (unit Pmdsp) is identified by its extremely flat surface in this example. In coastal Maine, elevation is another important variable. Marine clay (unit Pp) was deposited up to specific elevations across coastal portions of the state. This fact allows the mapper to interpret the contact based on elevation as shown in the lower portion of the figure. The till unit (Pt - upper right) is mapped above the elevation of the delta and marine clay.
What are the thin-drift areas?
Thin drift areas generally have less than 10 feet of surficial materials over bedrock. They represent areas where bedrock is close to the surface and may be exposed in many places.
Can I use the map to find sand and gravel deposits?
Geologic boundaries on a surficial geology map separate materials of different texture. By reading the map explanation (pdf) you will be able to identify which units contain sand and gravel. The associated surficial materials map may provide additional information about the depth of the deposit.
What else can a surficial geology map tell me?
By reading the description of the units shown on the map, you can find areas with different compositions -- sand and gravel, clay, or silt, for example. Sand and gravel areas will be better drained and better for home sites; clay areas may be wetter, with more swampy areas; clay bluffs along the shore or riverbanks may be susceptible to erosion and landslides.
What do the geologic units tell me about the geologic history of the quadrangle?
In addition to texture and composition, each geologic unit has a specific origin and history of deposition. Till was deposited directly from glacial ice. Eskers were deposited in meltwater tunnels beneath glacial ice. Marine clays and deltas were deposited during the period of the glacier's retreat when Maine's low-lying coastal areas were inundated by the sea. For an overview of Maine's history of glaciation, refer to Surficial Geologic History of Maine.
Tips for Reading the Maps - Map Symbols
What do the letter symbols represent?
Each color on the map represents a surficial material with a distinct texture and origin. Each geologic unit was deposited in a specific time period and has its own mix of surficial materials (sand, gravel, till, etc.). The letter symbols are made up of two elements: a capital letter at the beginning followed by one or more lower case letters (Figure 5). The age of deposition is represented by the capital letter at the beginning of the label: P - Pleistocene, Q - Quaternary; H - Holocene (geologic time chart). The remaining lower-case letters in the label refer either to the composition of the unit (e.g. Pt - Pleistocene till; Ha - Holocene alluvium) or to its origin and morphology (e.g. Pmd - Pleistocene marine delta; Pge - Pleistocene eskers; Pem - Pleistocene end moraines).
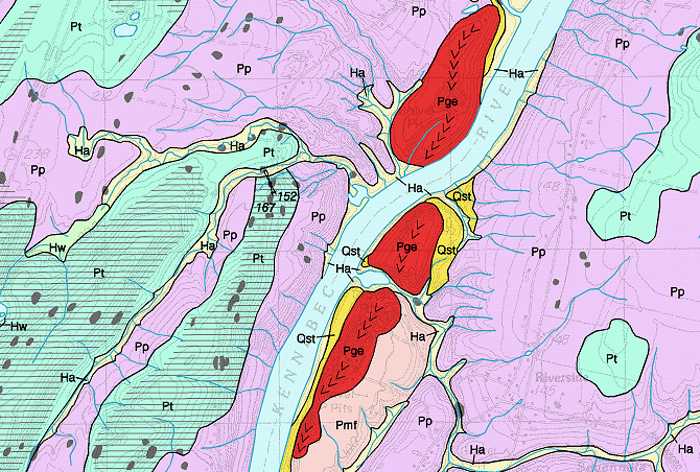
Figure 5. Portion of surficial geology map of the Vassalboro 7.5-minute quadrangle. Letter symbols are used to name the areas shown by different colors.
What do the symbols tell you about geologic history?
Symbols used on a surficial geology map show information related to the glacial history of the quadrangle. Refer to the sample map explanation (pdf) to view a selection of symbols often seen on surficial geology maps. Figure 6 shows an area with a variety of geologic symbols. Striations and drumlins show the direction of ice-flow during glaciation. Moraines and ice-margin lines show positions of glacial ice as it melted across the region. The delta elevation shows the level of the sea during the time that coastal Maine was inundated as the ice retreated. Meltwater channels show the direction of water flow over the land surface as the glacier retreated from the region.
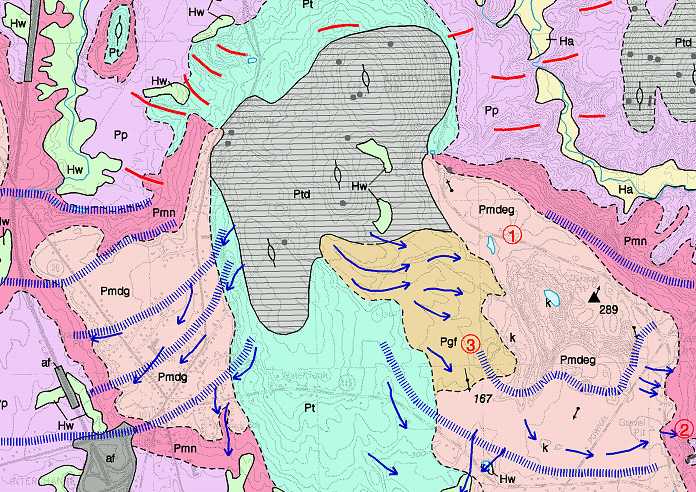
Figure 6. Portion of surficial geology map of the Gray 7.5-minute quadrangle. Geologic symbols are used to show information about glacial history. The map explanation (pdf) describes the symbols shown.
Tips for Reading the Maps - Related Maps
How does the surficial geology map relate to a surficial materials map?
Surficial materials maps show the actual field observations which help locate and classify sedimentary deposits. The geologist uses this information, in addition to air photos, topographic maps, soils maps, and wetlands maps to compile the surficial geology map.
How does the surficial geology map relate to a significant aquifers or coastal landslide hazards map?
Both significant sand and gravel aquifers and coastal landslide hazards maps are "derivative" maps which use a subset of the surficial geology information to create a specific map on a different topic. Sand and gravel areas shown on the surficial geology map are the starting point for interpreting the extent of significant sand and gravel aquifers. Areas of Presumpscot Formation (marine clay) are a key element in determining the landslide risk along Maine's coastal bluffs and along river and stream bluffs.
More Information
For more information on Maine's surficial geology, refer to the following page:
For further assistance in interpreting this map, contact a geologist at the Maine Geological Survey.
Last updated on April 26, 2012